使用树莓派4B安装ELK Stack来收集和分析服务器日志
ELK Stack:它由 Elasticsearch、Kibana、Beats 和 Logstash(也称为 ELK Stack)等组成。可靠、安全地从任何来源、任何格式获取数据,然后进行搜索、分析和可视化。ELK Stack是由三个开源工具组成的强大日志管理和分析平台,它们分别是Elasticsearch、Logstash和Kibana。这三个关键组件共同构成了一个完整的日志处理流程,从收集到存储,直到可视化展示,每个环节都是紧密相连的。ELK Stack官网
前期准备
树莓派4B一台(内存至少为4G)、TF内存卡(至少64G)、树莓派电源(5V3A)。
系统采用树莓派官方的Raspberry Pi OS系统,刷机过程不多赘述。
下载安装包
首先,我们需要下载Elasticsearch、Logstash和Kibana的安装包,因树莓派是aarch64架构,可以下载aarch64版的deb包,本教程以7.17.21版本为例,为了更直观的展示,以下操作我均以root用户进行安装操作。
wget https://artifacts.elastic.co/downloads/elasticsearch/elasticsearch-7.17.21-arm64.deb

wget https://artifacts.elastic.co/downloads/kibana/kibana-7.17.21-arm64.deb

wget https://artifacts.elastic.co/downloads/logstash/logstash-7.17.21-arm64.deb
下载完成后得到以下三个文件。
root@yuiit:~# ls

elasticsearch-7.17.21-arm64.deb  kibana-7.17.21-arm64.deb  logstash-7.17.21-arm64.deb
安装操作
用apt-get安装这三个安装包。
cd ~

apt install ./elasticsearch-7.17.21-arm64.deb

apt install ./kibana-7.17.21-arm64.deb

apt install ./logstash-7.17.21-arm64.deb
调整配置
Elasticsearch配置
编辑elasticsearch的配置文件。先修改/etc/elasticsearch/jvm.options配置文件,修改里面的-Xms4g和-Xmx4g项,我使用的树莓派4B为4G内存版,所以我计划将这个参数改为1g。
nano /etc/elasticsearch/jvm.options

------

## 取消这两项的注释,并修改为以下内容

-Xms1g

-Xmx1g

------
编辑/etc/elasticsearch/elasticsearch.yml配置文件,在配置文件底部添加以下项。
nano /etc/elasticsearch/elasticsearch.yml

------

cluster.name: my-pi-cluster

node.name: pi-node

network.host: 0.0.0.0

discovery.type: single-node

xpack.security.enabled: true

------
启动elasticsearch。
systemctl start elasticsearch.service

# 查看启动日志,启动过程需要一些时间,需要耐心等待

tail -fn 50 /var/log/elasticsearch/gc.log

# 启动完成后日志会显示程序运行在9200端口,查看9200端口是否正在监听

root@yuiit:~# lsof -i:9200

COMMAND   PID          USER   FD   TYPE DEVICE SIZE/OFF NODE NAME

java    23118 elasticsearch  297u  IPv6 165173      0t0  TCP *:9200 (LISTEN)
elasticsearch启动完成后需要配置用户名密码,可使用elasticsearch-setup-passwords进行用户名密码的初始化。
cd /usr/share/elasticsearch/bin

./elasticsearch-setup-passwords interactive
这时会提示如下回显,输入y以进行确认,然后为各个用户设置密码,这里我们统一都设置为[Aa123456.]。
Initiating the setup of passwords for reserved users elastic,apm_system,kibana,logstash_system,beats_system,remote_monitoring_user.

You will be prompted to enter passwords as the process progresses.

Please confirm that you would like to continue [y/N]y


Enter password for [elastic]: Aa123456.

Reenter password for [elastic]: Aa123456.

Enter password for [apm_system]: Aa123456.

Reenter password for [apm_system]: Aa123456.

Enter password for [kibana_system]: Aa123456.

Reenter password for [kibana_system]: Aa123456.

Enter password for [logstash_system]: Aa123456.

Reenter password for [logstash_system]: Aa123456.

Enter password for [beats_system]: Aa123456.

Reenter password for [beats_system]: Aa123456.

Enter password for [remote_monitoring_user]: Aa123456.

Reenter password for [remote_monitoring_user]: Aa123456.


Changed password for user [apm_system]

Changed password for user [kibana_system]

Changed password for user [logstash_system]

Changed password for user [beats_system]

Changed password for user [remote_monitoring_user]

Changed password for user [elastic]
设置完成后重启elasticsearch。
systemctl restart elasticsearch

systemctl enable elasticsearch

systemctl status elasticsearch
漫长的重启完成后,进行连通性测试。若回显如下,则配置完成。
root@yuiit:~# curl -u elastic:Aa123456. localhost:9200

{

  "name" : "pi-node",

  "cluster_name" : "my-pi-cluster",

  "cluster_uuid" : "96gwvTkrT2yoRihKAWCP4g",

  "version" : {

    "number" : "7.17.21",

    "build_flavor" : "default",

    "build_type" : "deb",

    "build_hash" : "d38e4b028f4a9784bb74de339ac1b877e2dbea6f",

    "build_date" : "2024-04-26T04:36:26.745220156Z",

    "build_snapshot" : false,

    "lucene_version" : "8.11.3",

    "minimum_wire_compatibility_version" : "6.8.0",

    "minimum_index_compatibility_version" : "6.0.0-beta1"

  },

  "tagline" : "You Know, for Search"

}
Kibana配置
修改kibana配置文件。修改配置文件中的内容。
nano /etc/kibana/kibana.yml

------

server.host: "0.0.0.0"

elasticsearch.hosts: ["http://localhost:9200"]

elasticsearch.username: "kibana_system"

elasticsearch.password: "Aa123456."

i18n.locale: "zh-CN"  #简体中文适配


------
启动kibana。
systemctl start kibana

systemctl enable kibana

systemctl status kibana
启动完成后可使用浏览器访问树莓派IP的5601端口,可进入kibana的web界面,正常情况下会进入登录界面。
用户名:elastic
密码:Aa123456.
首次进入后选择直接进入系统,不添加集成,直接进入默认界面。
配置Logstash
首先修改/etc/logstash/jvm.options配置文件。将占用内存限制在512M(比较极限,但不是不能用)。
nano /etc/logstash/jvm.options

------

-Xms512m

-Xmx512m

------
编辑logstash-sample.conf文件,内容如下,并给conf.d目录中也拷贝一份。
cd /etc/logstash

nano logstash-sample.conf

------

# Sample Logstash configuration for creating a simple

# Beats -> Logstash -> Elasticsearch pipeline.


input {

  beats {

    port => 5044

    codec => json_lines

  }

}


output {

  elasticsearch {

    hosts => ["http://localhost:9200"]

    index => "%{[@metadata][beat]}-%{[@metadata][version]}-%{+YYYY.MM.dd}"

    user => "elastic"

    password => "Aa123456."

  }

}

------

cat logstash-sample.conf > conf.d/logstash.conf
此时logstash-sample.conf和conf.d/logstash.conf的配置是一致的。使用logstash进行配置文件校验,校验时间较长需要耐心等待,若回显内容包含Configuration OK,则说明配置文件正确。
/usr/share/logstash/bin/logstash -f /etc/logstash/conf.d/logstash.conf --config.test_and_exit
启动logstash。启动时间较长,可查看日志确认是否正常启动。
systemctl start logstash

systemctl enable logstash
只到日志显示如下信息后,才算正常启动。
root@yuiit:/etc/logstash# tail -f /var/log/logstash/logstash-plain.log

[2025-04-30T10:10:55,115][WARN ][logstash.outputs.elasticsearch][main] Detected a 6.x and above cluster: the `type` event field won't be used to determine the document _type {:es_version=>7}

[2025-04-30T10:10:55,366][INFO ][logstash.outputs.elasticsearch][main] Config is not compliant with data streams. `data_stream => auto` resolved to `false`

[2025-04-30T10:10:55,375][INFO ][logstash.outputs.elasticsearch][main] Config is not compliant with data streams. `data_stream => auto` resolved to `false`

[2025-04-30T10:10:55,614][INFO ][logstash.outputs.elasticsearch][main] Using a default mapping template {:es_version=>7, :ecs_compatibility=>:disabled}

[2025-04-30T10:10:56,397][INFO ][logstash.javapipeline    ][main] Starting pipeline {:pipeline_id=>"main", "pipeline.workers"=>4, "pipeline.batch.size"=>125, "pipeline.batch.delay"=>50, "pipeline.max_inflight"=>500, "pipeline.sources"=>["/etc/logstash/conf.d/logstash.conf"], :thread=>"#<Thread:0xa2468a2 run>"}

[2025-04-30T10:11:00,626][INFO ][logstash.javapipeline    ][main] Pipeline Java execution initialization time {"seconds"=>4.22}

[2025-04-30T10:11:00,706][INFO ][logstash.inputs.beats    ][main] Starting input listener {:address=>"0.0.0.0:5044"}

[2025-04-30T10:11:00,753][INFO ][logstash.javapipeline    ][main] Pipeline started {"pipeline.id"=>"main"}

[2025-04-30T10:11:00,975][INFO ][logstash.agent           ] Pipelines running {:count=>1, :running_pipelines=>[:main], :non_running_pipelines=>[]}

[2025-04-30T10:11:01,190][INFO ][org.logstash.beats.Server][main][2e5bd4de81fe2e8bda606b1da25ec416498a3651dd5bb91041667e8b03f5be2c] Starting server on port: 5044
配置完以上三项内容后,理论上kibana/Logstash已经和Elasticsearch接通成功。
检查服务情况
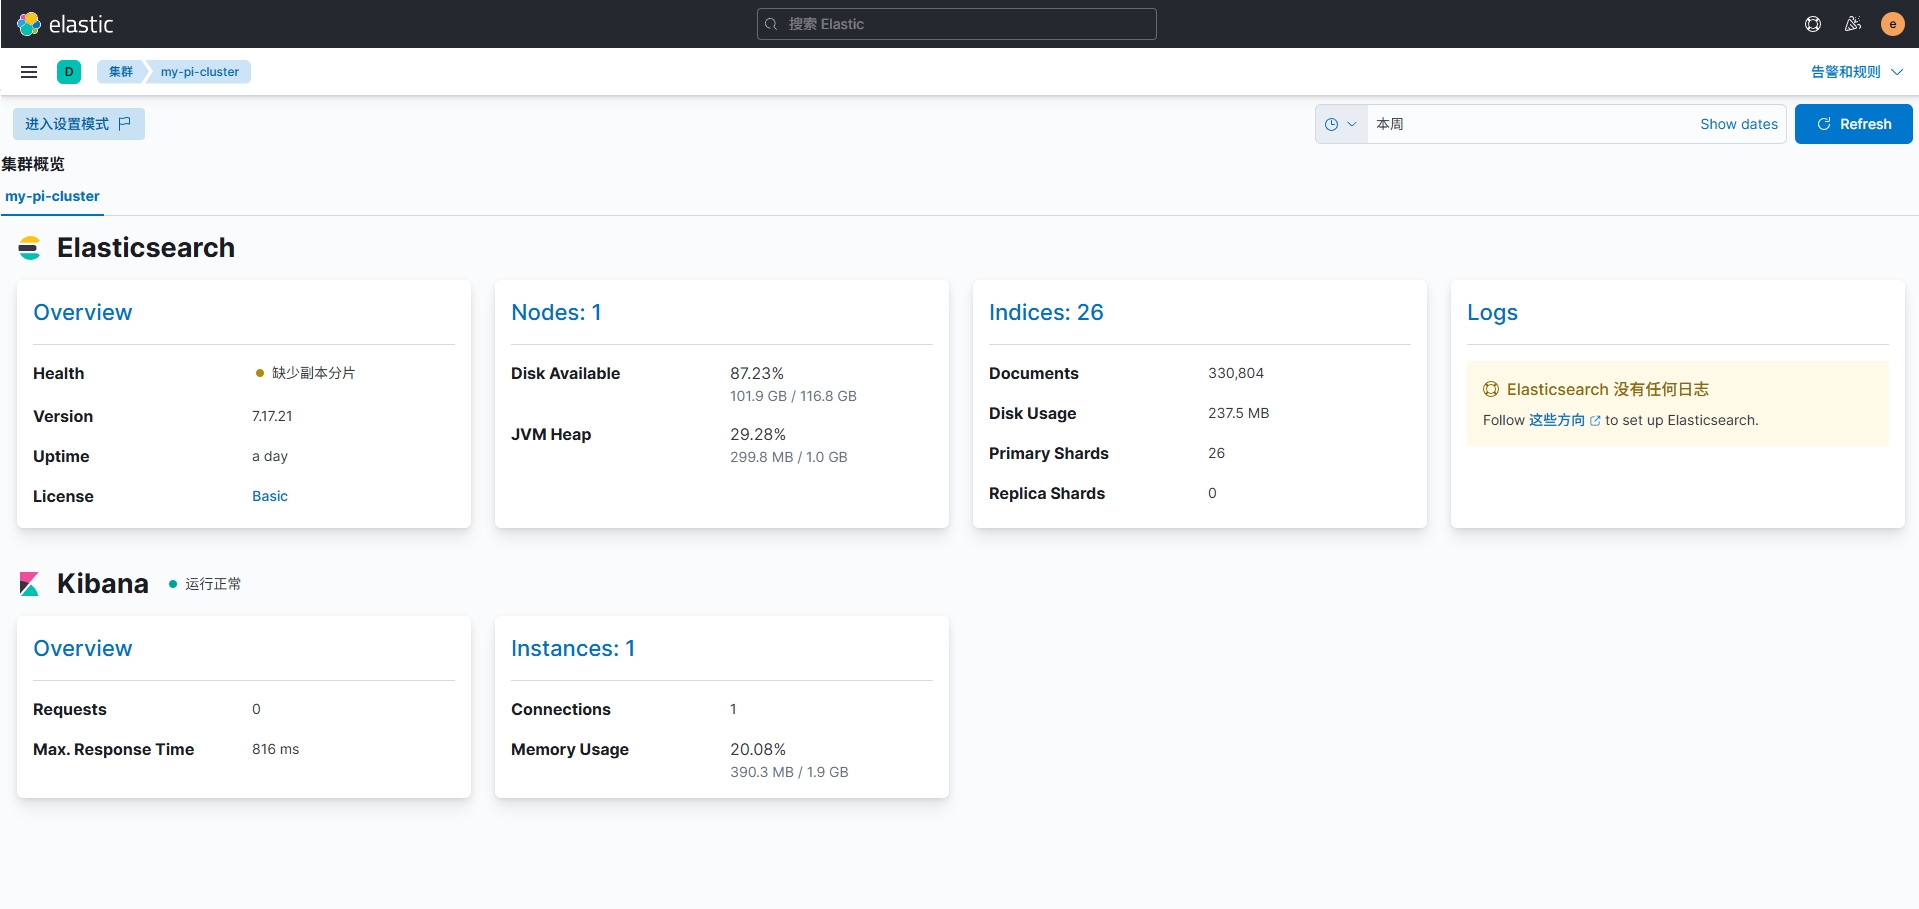
进入kibana界面,在左侧菜单的Management找到堆栈监测,点击"Or, set up with self monitoring",再点击"Turn on monitoring",转圈完成后可以看到集群概览界面。(我这里Health为黄色警告,显示缺少副本分片,可能是因为分配内存过少?不过不影响正常写入和查询。)
Logstash规则配置
LogStash可以根据配置文件中的规则,对日志中的字段进行匹配并将匹配后的信息存入Elasticsearch。
以下是一个简单的Nginx的规则配置,我尝试做了一些SQL注入之类的识别规则,比较不完善仅为参考之用。
nano /etc/logstash/conf.d/logstash.conf

------

# Sample Logstash configuration for creating a simple

# Beats -> Logstash -> Elasticsearch pipeline.


input {

  beats {

    port => 5044

  }

}


filter {

  # 1. 使用 Grok 解析 Nginx 日志格式

  grok {

    match => {

      "message" => '%{IP:client_ip} - - \[%{HTTPDATE:timestamp}\] "%{WORD:http_method} %{URIPATHPARAM:http_url} HTTP/%{NUMBER:http_version}" %{NUMBER:status_code} %{NUMBER:body_bytes_sent} "%{DATA:http_referer}" "%{DATA:user_agent}"'

    }

    remove_field => ["message"]  # 可选:移除原始日志以减少存储

  }


  date {

    match => ["timestamp", "dd/MMM/yyyy:HH:mm:ss Z"]

    target => "@timestamp"

  }

  # SQL注入匹配规则

  if "select" in [http_url] or

     "union" in [http_url] or

     "insert" in [http_url] or

     "update" in [http_url] or

     "delete" in [http_url] or

     "drop" in [http_url] or

     "--" in [http_url] or

     "%27" in [http_url] or

     "%3B" in [http_url] or

     "%2F*" in [http_url] or

     "*%2F" in [http_url] or

     "benchmark" in [http_url] or

     "sleep" in [http_url] or

     "waitfor" in [http_url] or

     "pg_sleep" in [http_url] or

     "select" in [http_referer] or

     "union" in [http_referer] or

     "insert" in [http_referer] or

     "update" in [http_referer] or

     "delete" in [http_referer] or

     "drop" in [http_referer] or

     "--" in [http_referer] or

     "%27" in [http_referer] or

     "%3B" in [http_referer] or

     "%2F*" in [http_referer] or

     "*%2F" in [http_referer] or

     "benchmark" in [http_referer] or

     "sleep" in [http_referer] or

     "waitfor" in [http_referer] or

     "pg_sleep" in [http_referer] {

    mutate {

      add_field => { "threat_type" => "SQL注入" }

      add_field => { "threat_id" => "1"}

    }

  }


  # 404状态码捕获

  if "404" in [status_code] {

    mutate {

      add_field => { "threat_type" => "404未找到资源" }

      add_field => { "threat_id" => "2" }

    }

  }


  # 50X状态码捕获

  if "500" in [status_code] or

    "501" in [status_code] or

    "502" in [status_code] or

    "503" in [status_code] or

    "504" in [status_code] {

    mutate {

      add_field => { "threat_type" => "50X服务器内部错误" }

      add_field => { "threat_id" => "3" }

    }

  }


  # 检查目录遍历攻击模式

  if "..." in [http_url] or

     "../" in [http_url] or

     ".env" in [http_url] or

     "/etc/passwd" in [http_url] or

     "admin.php" in [http_url] or

     "config.php" in [http_url] or

     "php://input" in [http_url] or

     "php://filter" in [http_url] {

    mutate {

      add_field => { "threat_type" => "疑似目录遍历攻击" }

      add_field => { "threat_id" => "4" }

    }

  }


  # 检查敏感文件访问

  if ".env" in [http_url] or

     "/etc/passwd" in [http_url] or

     "/etc/shadow" in [http_url] or

     "/root/" in [http_url] or

     "config.php" in [http_url] or

     "admin.php" in [http_url] or

     "mysql.sock" in [http_url] or

     "wp-config.php" in [http_url] {

    mutate {

      add_field => { "threat_type" => "疑似敏感文件访问" }

      add_field => { "threat_id" => "5" }

    }

  }


  # 恶意扫描工具 User-Agent

  if "sqlmap" in [user_agent] or

     "nmap" in [user_agent] or

     "wget" in [user_agent] or

     "curl" in [user_agent] or

     "zgrab" in [user_agent] or

     "nikto" in [user_agent] or

     "burpsuite" in [user_agent] {

    mutate {

      add_field => { "threat_type" => "疑似恶意扫描" }

      add_field => { "threat_id" => "6" }

    }

  }


  # Webshell 特征检测

  if ".php?" in [http_url] and (

     "cmd=" in [http_url] or

     "eval=" in [http_url] or

     "system=" in [http_url] or

     "shell=" in [http_url] or

     "exec=" in [http_url] or

     "passthru=" in [http_url] or

     "popen=" in [http_url] or

     "fpassthru=" in [http_url] ) {

    mutate {

      add_field => { "threat_type" => "疑似Webshell攻击" }

      add_field => { "threat_id" => "7" }

    }

  }


  # 挖矿池域名访问

  if "xmrpool" in [http_url] or

     "monero" in [http_url] or

     "minexmr" in [http_url] or

     "nanopool" in [http_url] {

    mutate {

      add_field => { "threat_type" => "疑似挖矿病毒" }

      add_field => { "threat_id" => "8" }

    }

  }


  # 爬虫访问检测

  if "googlebot" in [user_agent] or

     "baidu" in [user_agent] or

     "bingbot" in [user_agent] or

     "yandex" in [user_agent] or

     "slurp" in [user_agent] or

     "duckduckbot" in [user_agent] or

     "archive.org" in [user_agent] or

     "spider" in [user_agent] or

     "crawl" in [user_agent] or

     "bot" in [user_agent] or

     "crawlbot" in [user_agent] or

     "facebookexternalhit" in [user_agent] {

    mutate {

      add_field => { "threat_type" => "疑似爬虫访问" }

      add_field => { "threat_id" => "9" }

    }

  }


}


output {

  elasticsearch {

    hosts => ["http://localhost:9200"]

    index => "%{[@metadata][beat]}-%{[@metadata][version]}-%{+YYYY.MM.dd}"

    user => "elastic"

    password => "Aa123456."

  }

}

------
配置完成后重启Logstash生效。
安装FileBeat
接下来在节点服务器配置FileBeat服务,FileBeat可将服务器内的日志收集好并传给LogStash,由LogStash进行分析后写入Elasticsearch。
下载FileBeat程序文件,这里的被监控端我们以Debian12为例。
cd ~

wget https://artifacts.elastic.co/downloads/beats/filebeat/filebeat-7.17.21-amd64.deb

apt install ./filebeat-7.17.21-amd64.deb
安装完成后编辑filebeat配置文件/etc/filebeat/filebeat.yml。修改部分参数,假设nginx日志在/var/log/nginx目录下。将output.elasticsearch相关的连接配置信息全部注释,改为配置output.logstash项。
nano /etc/filebeat/filebeat.yml

------

- type: filestream

  id: filebeat-01

  paths:

    - /var/log/nginx/*.log

output.logstash:

  # The Logstash hosts

  hosts: ["树莓派的IP:5044"]


  # Optional SSL. By default is off.

  # List of root certificates for HTTPS server verifications

  #ssl.certificate_authorities: ["/etc/pki/root/ca.pem"]


  # Certificate for SSL client authentication

  #ssl.certificate: "/etc/pki/client/cert.pem"


  # Client Certificate Key

  #ssl.key: "/etc/pki/client/cert.key"


## 将以下内容全部注释

#output.elasticsearch:

  # Array of hosts to connect to.

  #hosts: ["localhost:9200"]


  # Protocol - either `http` (default) or `https`.

  #protocol: "https"


  # Authentication credentials - either API key or username/password.

  #api_key: "id:api_key"

  #username: "elastic"

  #password: "changeme"

------
启动filebeat。
systemctl start filebeat

systemctl enable filebeat

systemctl status filebeat
显示如下,启动成功。
root@filebeat:/etc/filebeat# systemctl status filebeat.service

* filebeat.service - Filebeat sends log files to Logstash or directly to Elasticsearch.

     Loaded: loaded (/lib/systemd/system/filebeat.service; enabled; preset: enabled)

     Active: active (running) since Wed 2025-04-30 02:11:11 UTC; 7h ago

       Docs: https://www.elastic.co/beats/filebeat

   Main PID: 4273 (filebeat)

      Tasks: 7 (limit: 38092)

     Memory: 32.7M

        CPU: 8.794s

     CGroup: /system.slice/filebeat.service

             `-4273 /usr/share/filebeat/bin/filebeat --environment systemd -c /etc/filebeat/filebeat.yml --path.home /usr/share/filebeat --path.config /etc/filebeat --path.data /var/lib>


Apr 30 09:52:24 filebeat filebeat[4273]: 2025-04-30T09:52:24.354Z        WARN        [file_watcher]        filestream/fswatch.go:204        file "/var/log/nginx/panel-assess-access.log">

Apr 30 09:52:34 filebeat filebeat[4273]: 2025-04-30T09:52:34.354Z        WARN        [file_watcher]        filestream/fswatch.go:204        file "/var/log/nginx/panel-assess-access.log">

Apr 30 09:52:34 filebeat filebeat[4273]: 2025-04-30T09:52:34.354Z        WARN        [file_watcher]        filestream/fswatch.go:204        file "/var/log/nginx/uptime-assess-access.log>

Apr 30 09:52:34 filebeat filebeat[4273]: 2025-04-30T09:52:34.354Z        WARN        [file_watcher]        filestream/fswatch.go:204        file "/var/log/nginx/panel-assess-errors.log">

Apr 30 09:52:34 filebeat filebeat[4273]: 2025-04-30T09:52:34.354Z        WARN        [file_watcher]        filestream/fswatch.go:204        file "/var/log/nginx/uptime-assess-errors.log>

Apr 30 09:52:44 filebeat filebeat[4273]: 2025-04-30T09:52:44.358Z        INFO        [monitoring]        log/log.go:184        Non-zero metrics in the last 30s        {"monitoring": {"m>

Apr 30 09:52:44 filebeat filebeat[4273]: 2025-04-30T09:52:44.358Z        WARN        [file_watcher]        filestream/fswatch.go:204        file "/var/log/nginx/panel-assess-access.log">

Apr 30 09:52:44 filebeat filebeat[4273]: 2025-04-30T09:52:44.358Z        WARN        [file_watcher]        filestream/fswatch.go:204        file "/var/log/nginx/panel-assess-errors.log">

Apr 30 09:52:44 filebeat filebeat[4273]: 2025-04-30T09:52:44.358Z        WARN        [file_watcher]        filestream/fswatch.go:204        file "/var/log/nginx/uptime-assess-errors.log>

Apr 30 09:52:44 filebeat filebeat[4273]: 2025-04-30T09:52:44.358Z        WARN        [file_watcher]        filestream/fswatch.go:204        file "/var/log/nginx/uptime-assess-access.log>

lines 1-21/21 (END)
创建索引模式
进入kibana界面,在左侧菜单中进入Discover,此时这里可能是空的,需要创建索引模式,点击右上方选项,进入"View Discover settings",在左侧Kibana项中进入索引模式,默认显示的索引模式应该包含 "metrics-" 和 "logs-" ,在右上角创建索引模式,此时就可以看到右侧多出了filebeat推送过来的索引信息。
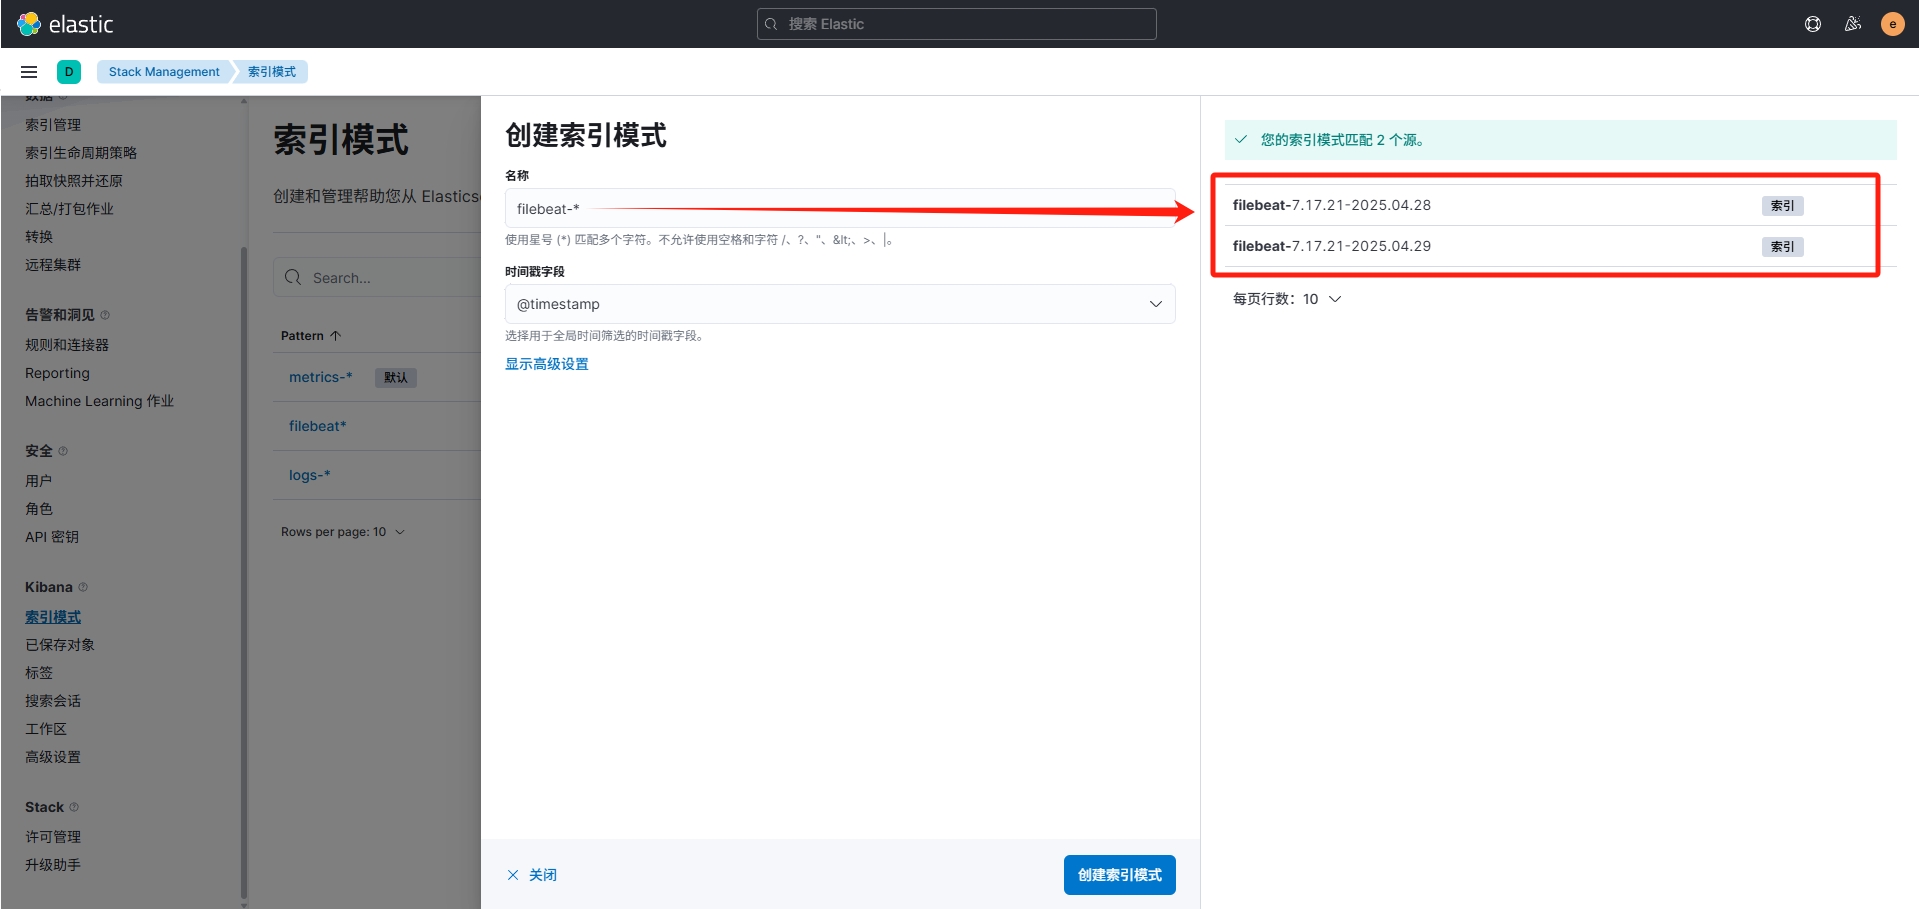
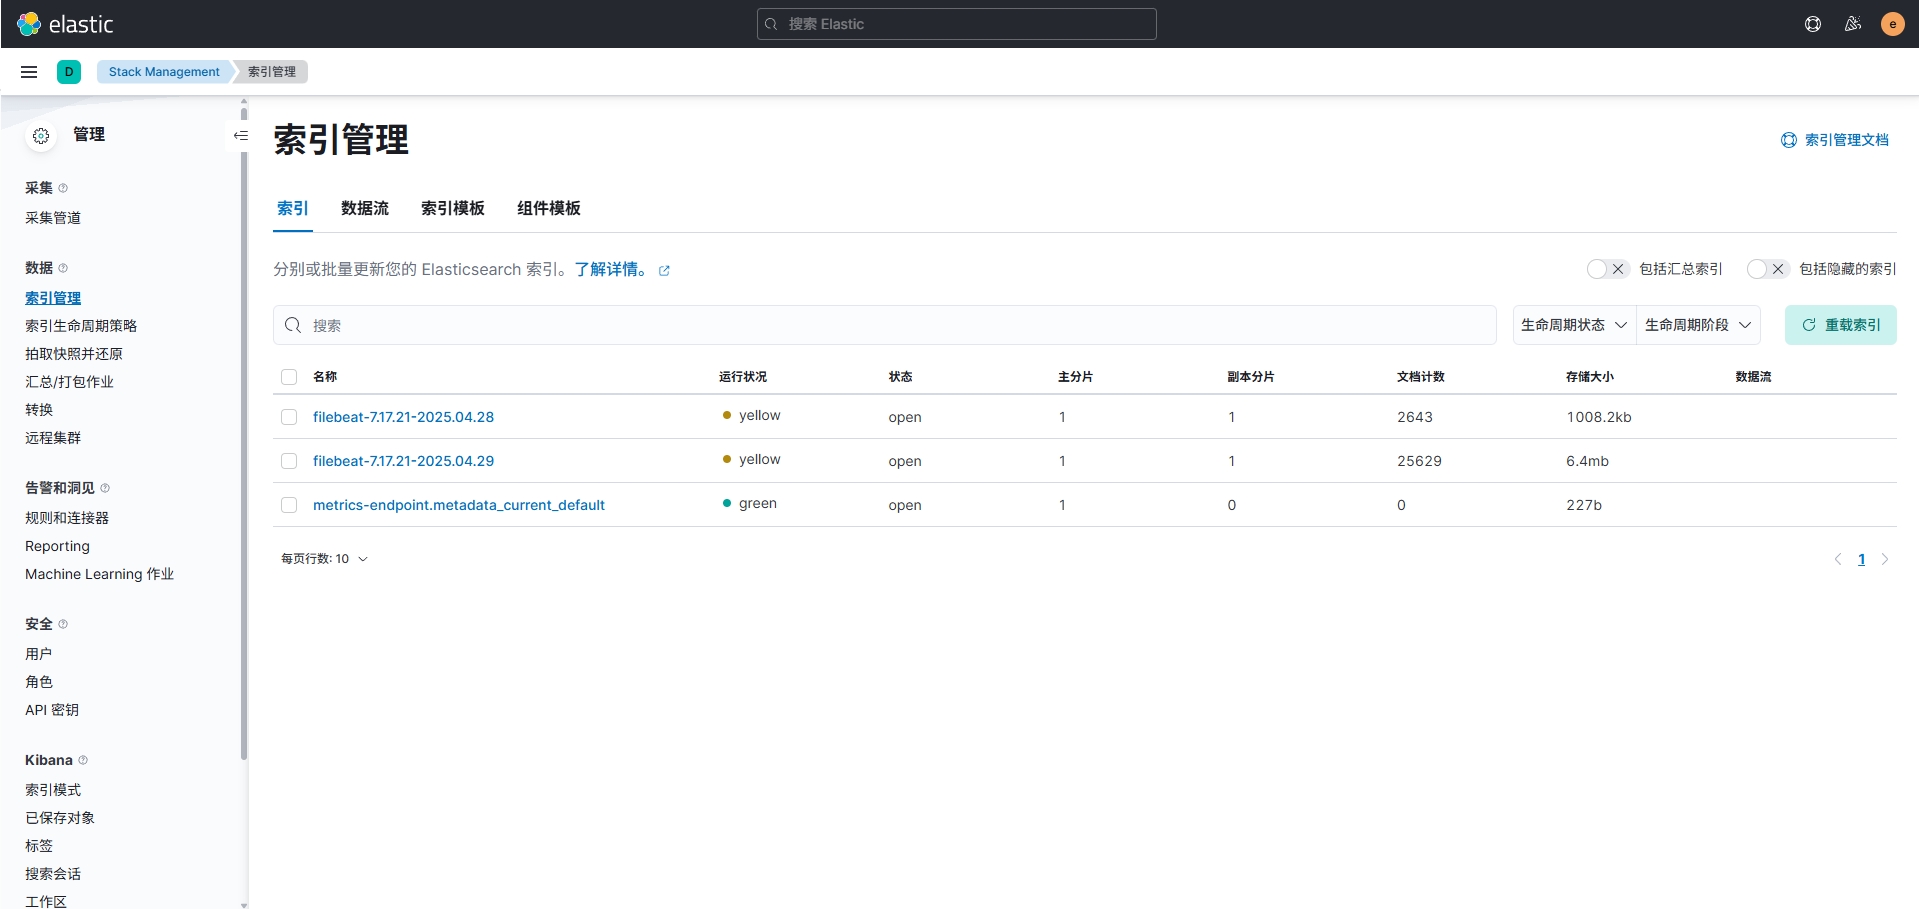
创建完成后,在左侧索引管理中可以看到引用进来的索引表信息。
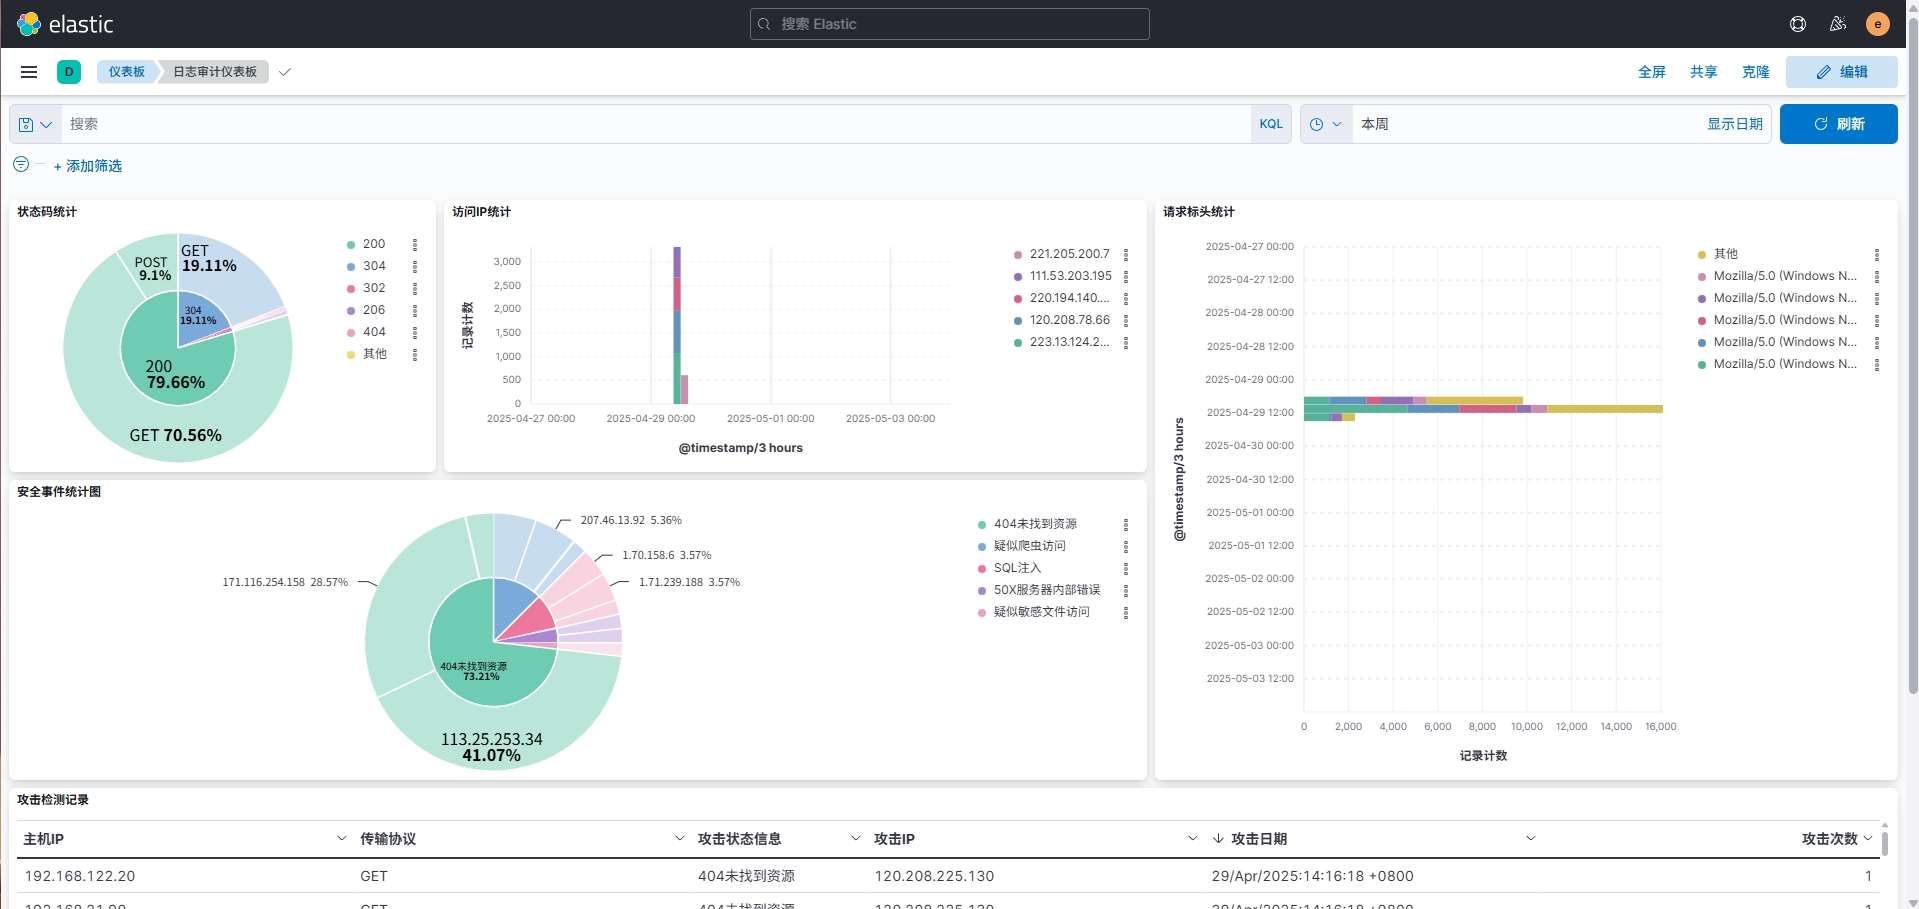
构建面板图表
索引配置完成后进入Discover中,选择filebeat-*,就可看到所有传输进来的Nginx日志。在Overview中创建仪表板,依照自己的需求创建仪表板结构并指定图表中的字段,最终简单实现的效果如下。